52% of Top 1,000 Institutions Are Using Course Materials Access Programs

Half of the Top 1,000 Institutions, by Headcount, are Using Course Materials Access Programs
A question I have been asked many times over the last few years is whether I have a list, or know if one exists, of all the institutions who have adopted course materials intervention models like Inclusive and Equitable Access. In my conversations with various stakeholders I’ve seen bits and pieces of lists. Many of them are incomplete or lack key details about the institutions. I have always wondered why one didn’t exist. Surely, there had to be someone who compiled a detailed list.
Let’s Build It
As many of you know, I transitioned out of working in and around course materials in a direct, day-to-day capacity almost a year ago. So, I haven’t had the time or resources to dedicate to making a list. However, after an intense conversation with some campus leaders a few months ago, I decided I needed this list, even if just for myself. So, I set out to do it. It took several months of nights and weekends, but here we are. I have a…partial list. I’ve scoped the top 1,000 institutions by headcount according to available IPEDS data to determine if they are using a course materials intervention model like Inclusive and Equitable Access.
Approach and Process
Creating a list of just names of institutions using course materials intervention models wasn’t going to cut it. I needed to understand which schools were using these models, where they were located, their size, whether or not they were a Minority Serving Institution, and some other data points about them I wasn’t sure I wanted or will even use. The usefulness of this list was going to be determined by how detailed I could make it.
I started with IPEDS. My institutional selection condition was Title IV (federal financial aid) participation status. If the institution wasn’t participating in or eligible for Title IV, they didn’t make the list. After I had my list of 5,918 institutions, I had to select my variables. Beyond the IPEDS ID and institutional name, I have 23 other potential IPEDS variables by which to segment. To round out the top 1,000 list with information not available in IPEDS, I used a combination of personal knowledge and comprehensive desk research. There are some limitations to this approach which I will address later.
By the Numbers
There are over 5,900 institutions of higher education who are participating in or eligible for Title IV federal financial aid funding, according to IPEDS. These range from schools with 10 students to over 200,000 students. Focusing on the Top 1,000 institutions (16.90% of the total available institutions), I found there are 524 (52.40%) institutions using some variation of a course materials intervention model like Inclusive and Equitable Access. Of those 524 institutions, 411 (78.44%) are using Inclusive Access and 113 (21.56%) are using Equitable Access.
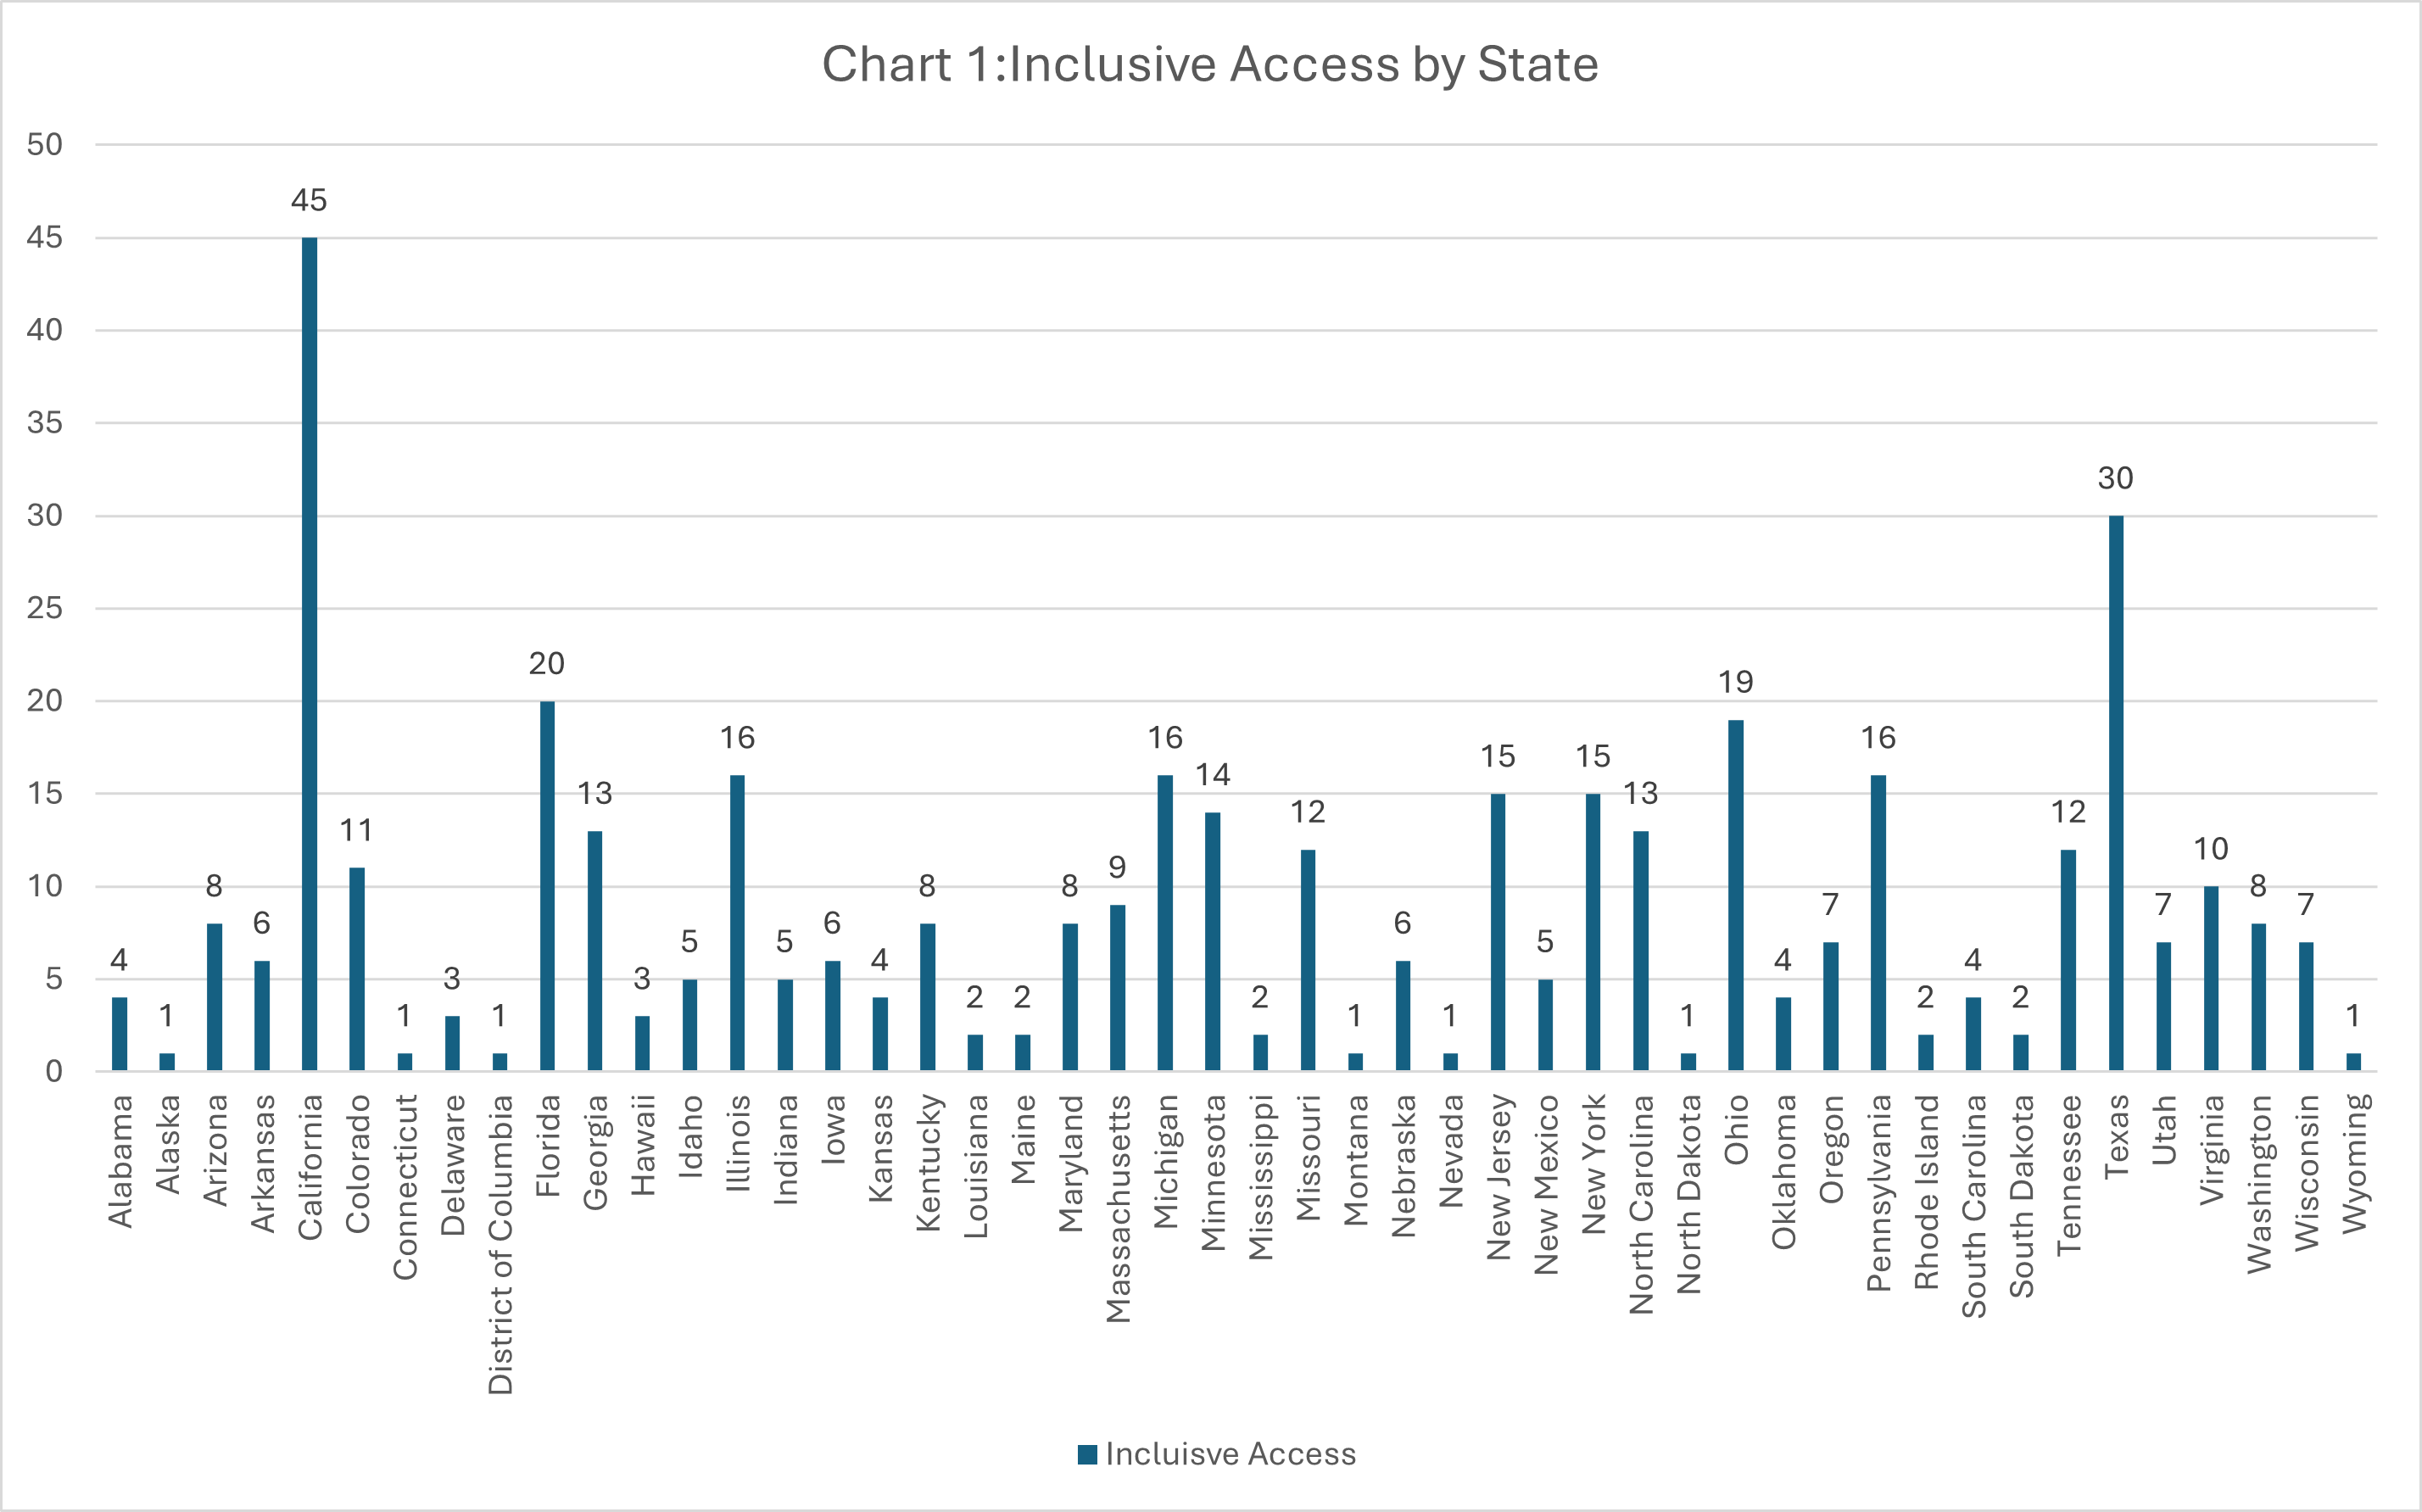
As we review some of the data, remember this data is only from the Top 1,000 institutions by headcount per IPEDS. Chat 1 highlights inclusive access programs by state. California leads the way with 45 institutions using some sort of course by course access model and Texas is second with 30.
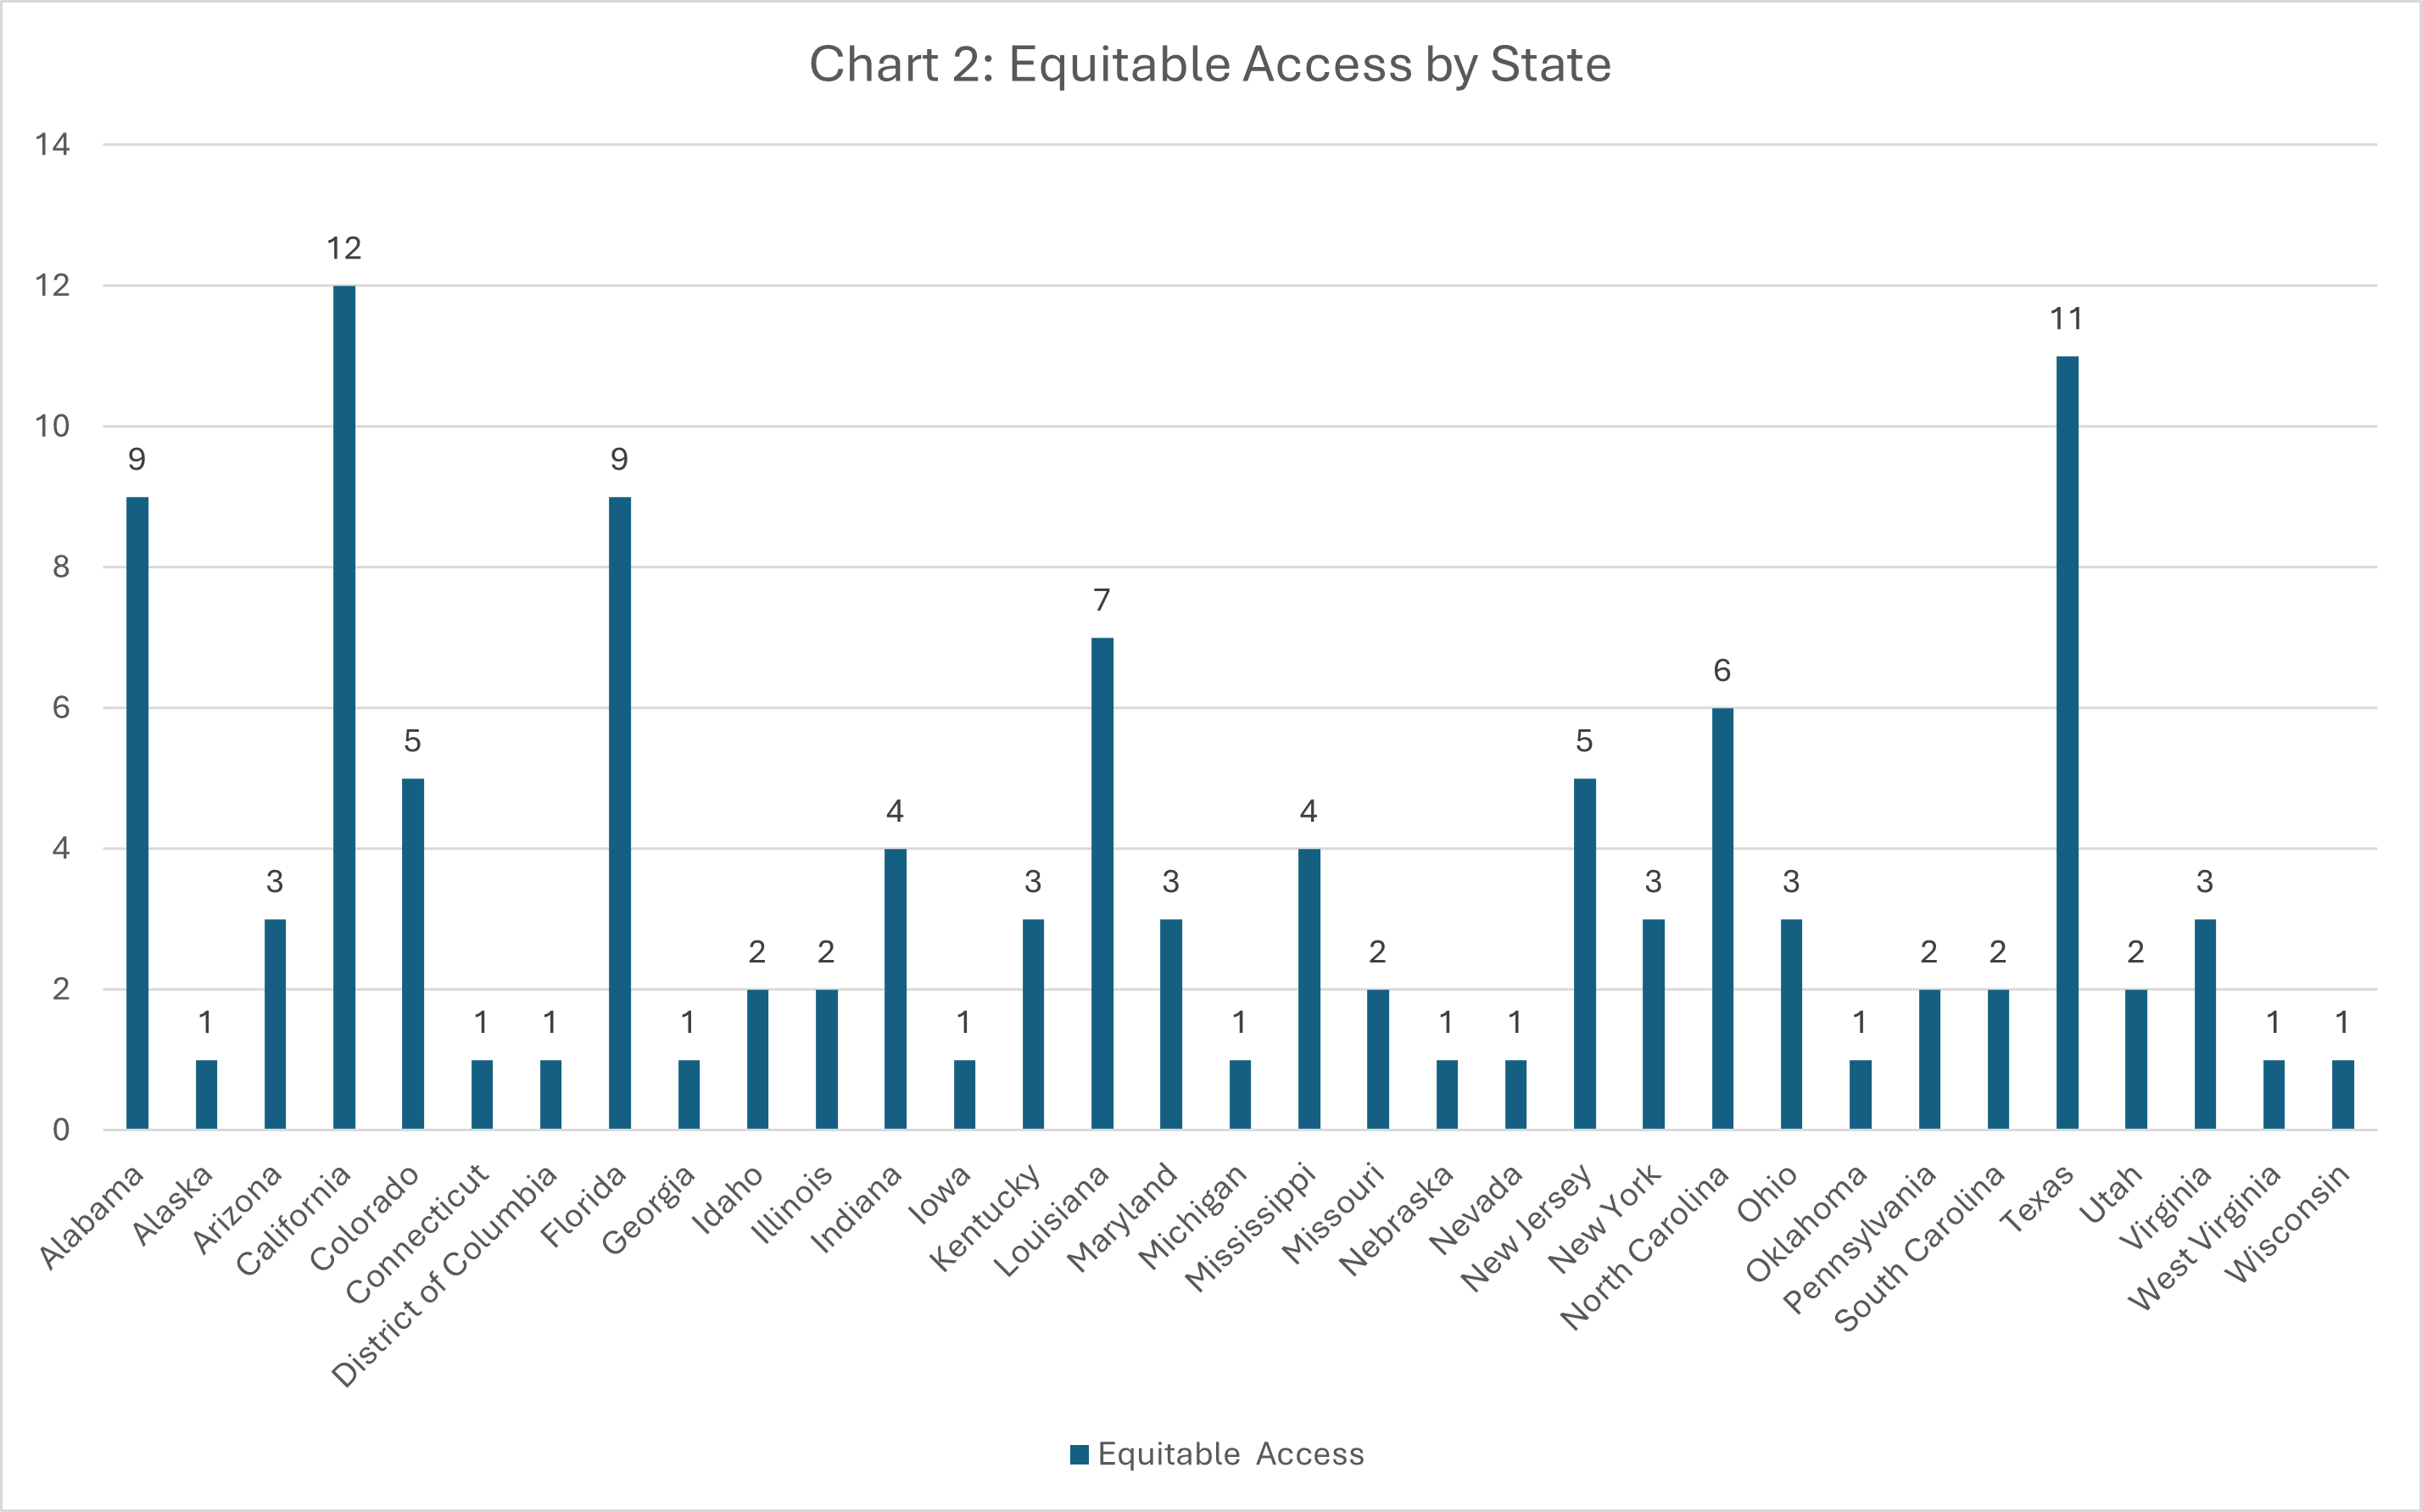
Chart 2 examines the number of institutions in the top 1,000 using a campus-wide model. Again, California leads the way with 12, but Texas with 11 and Florida with 9 are close behind.
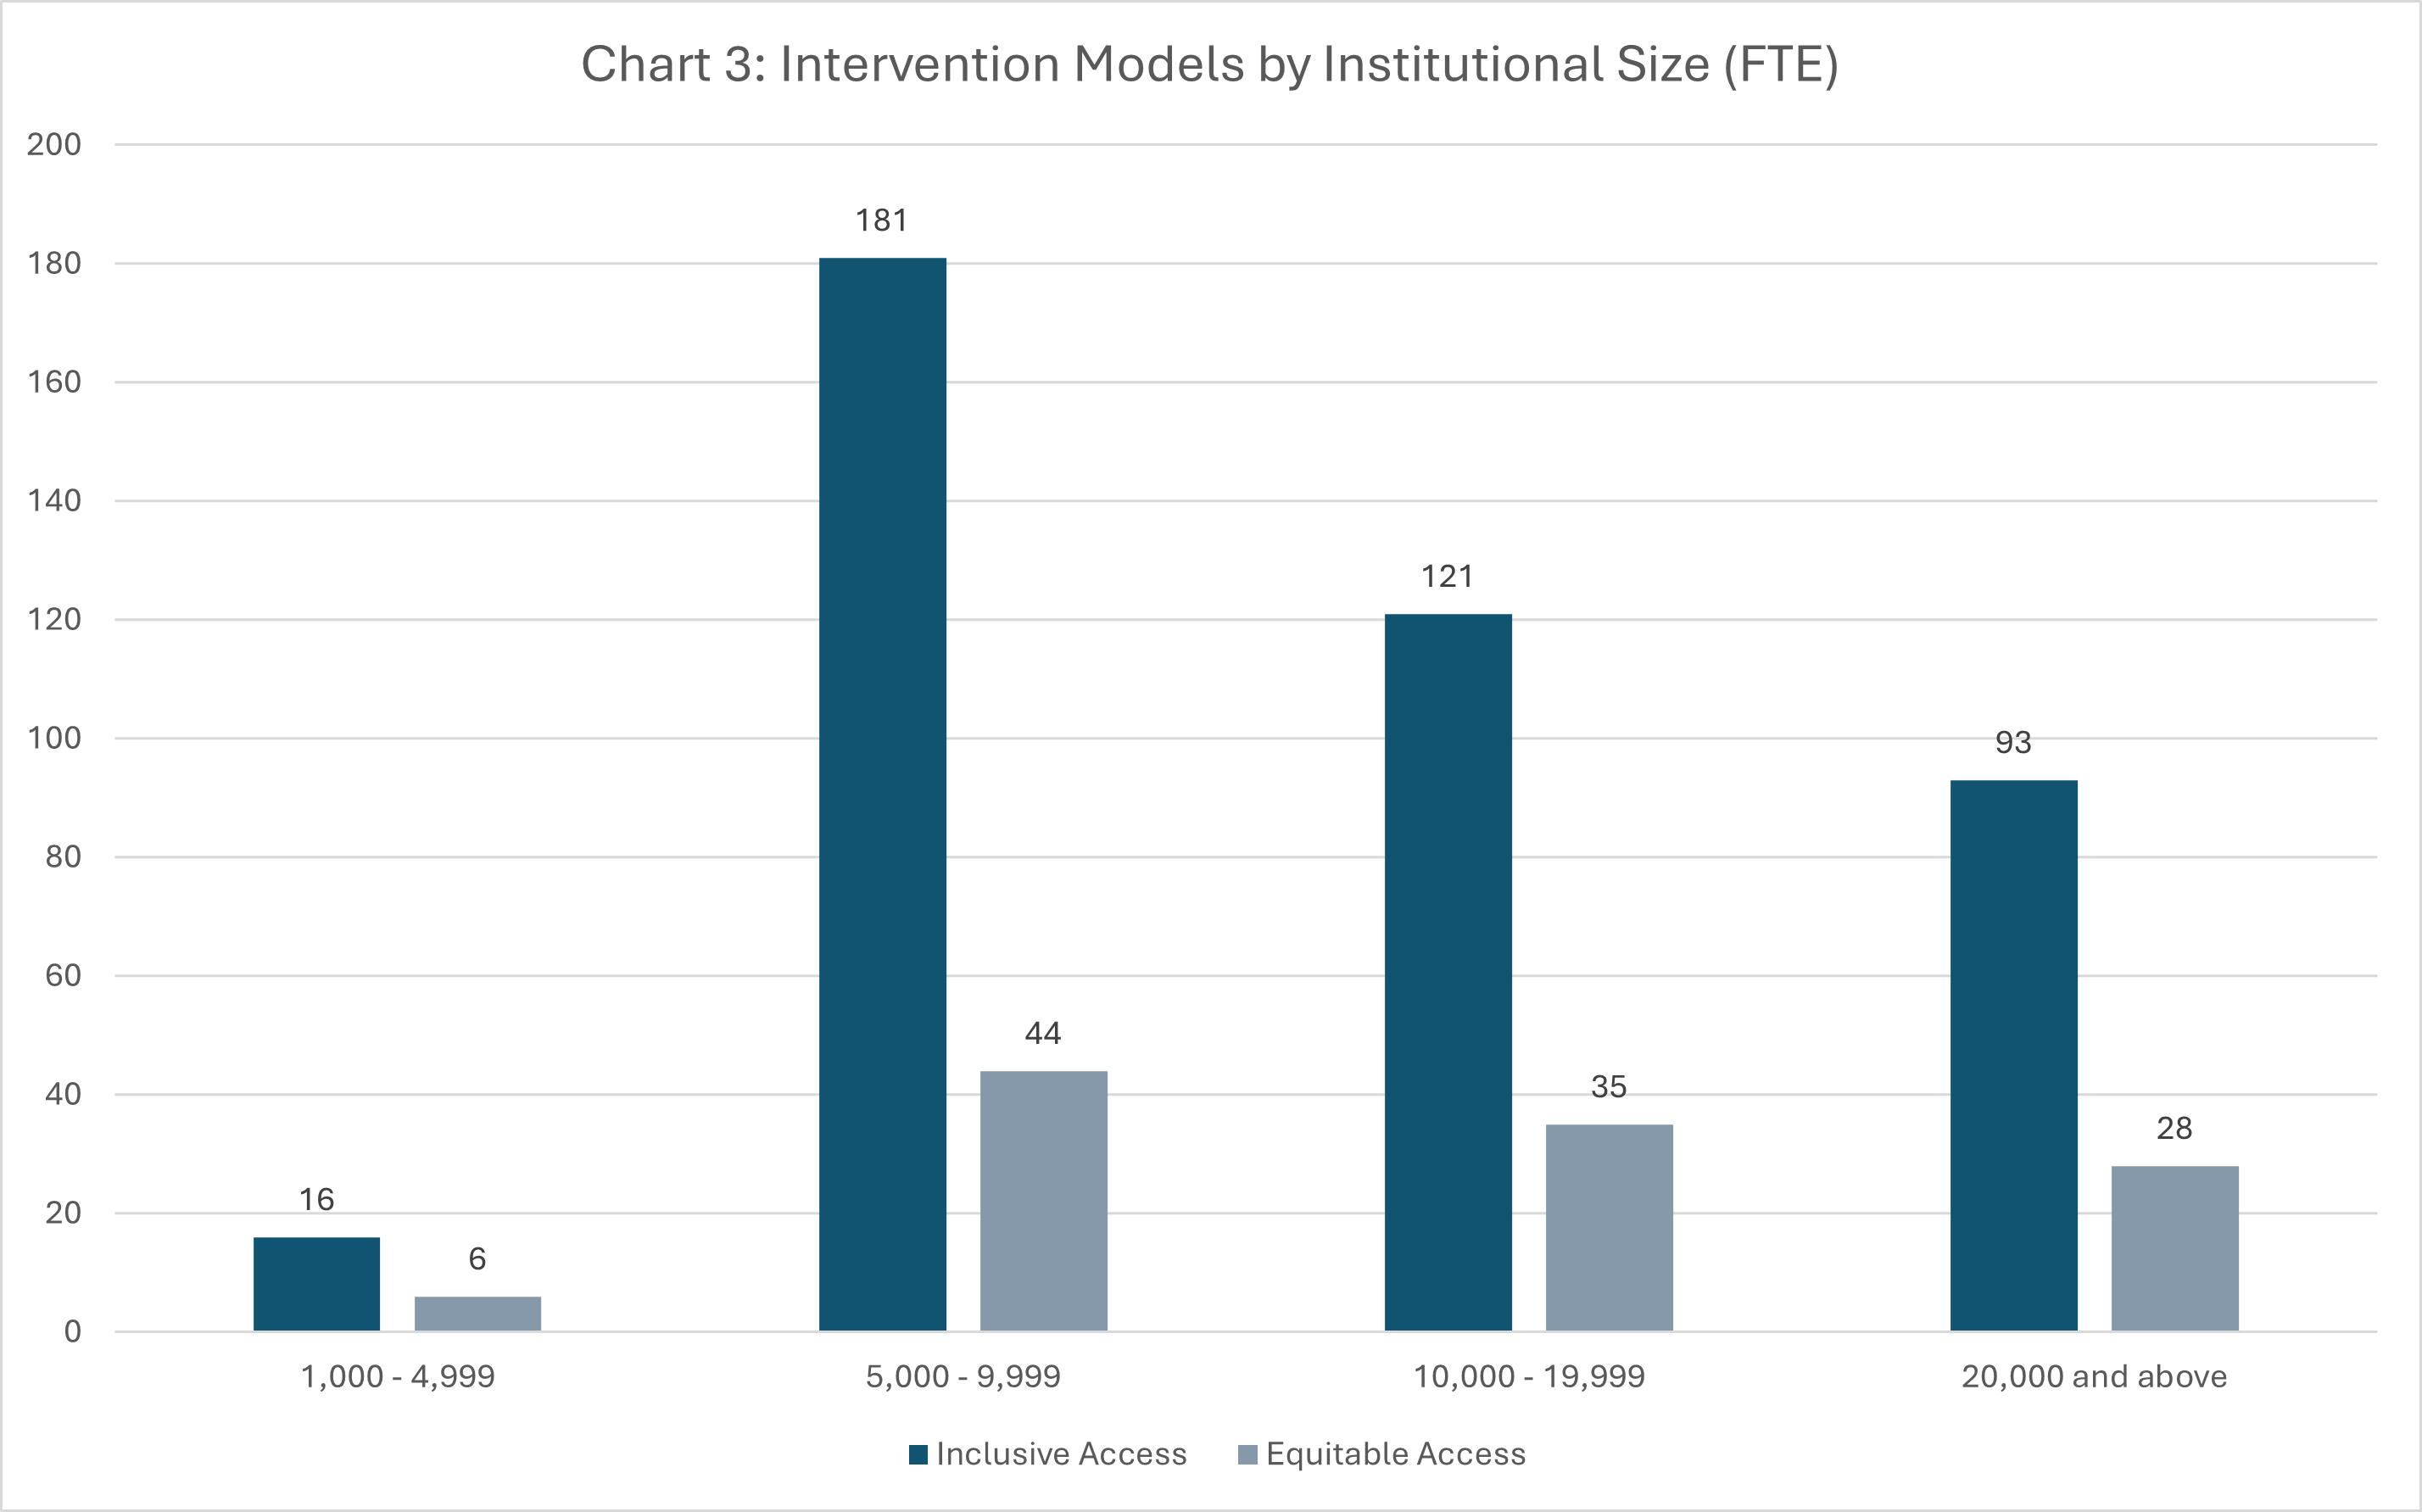
Something I, and many others, have wondered over the last few years is whether or not there is a particular type of institution that is more likely to adopted these course materials intervention models. I think the next few charts give us a pretty good picture from the Top 1,000. Admittedly, it is very possible these graphs change as we expand the list from 1,000 to 2,000 and beyond. Chart 3 examines access program types by institutional size. For this chart, institutional size can be read as FTE or Full-Time Equivalent, which is a different metric than the headcount metric with which I started. I like this metric because it buckets institutions into groups more easily than using the widely varying headcount metric.
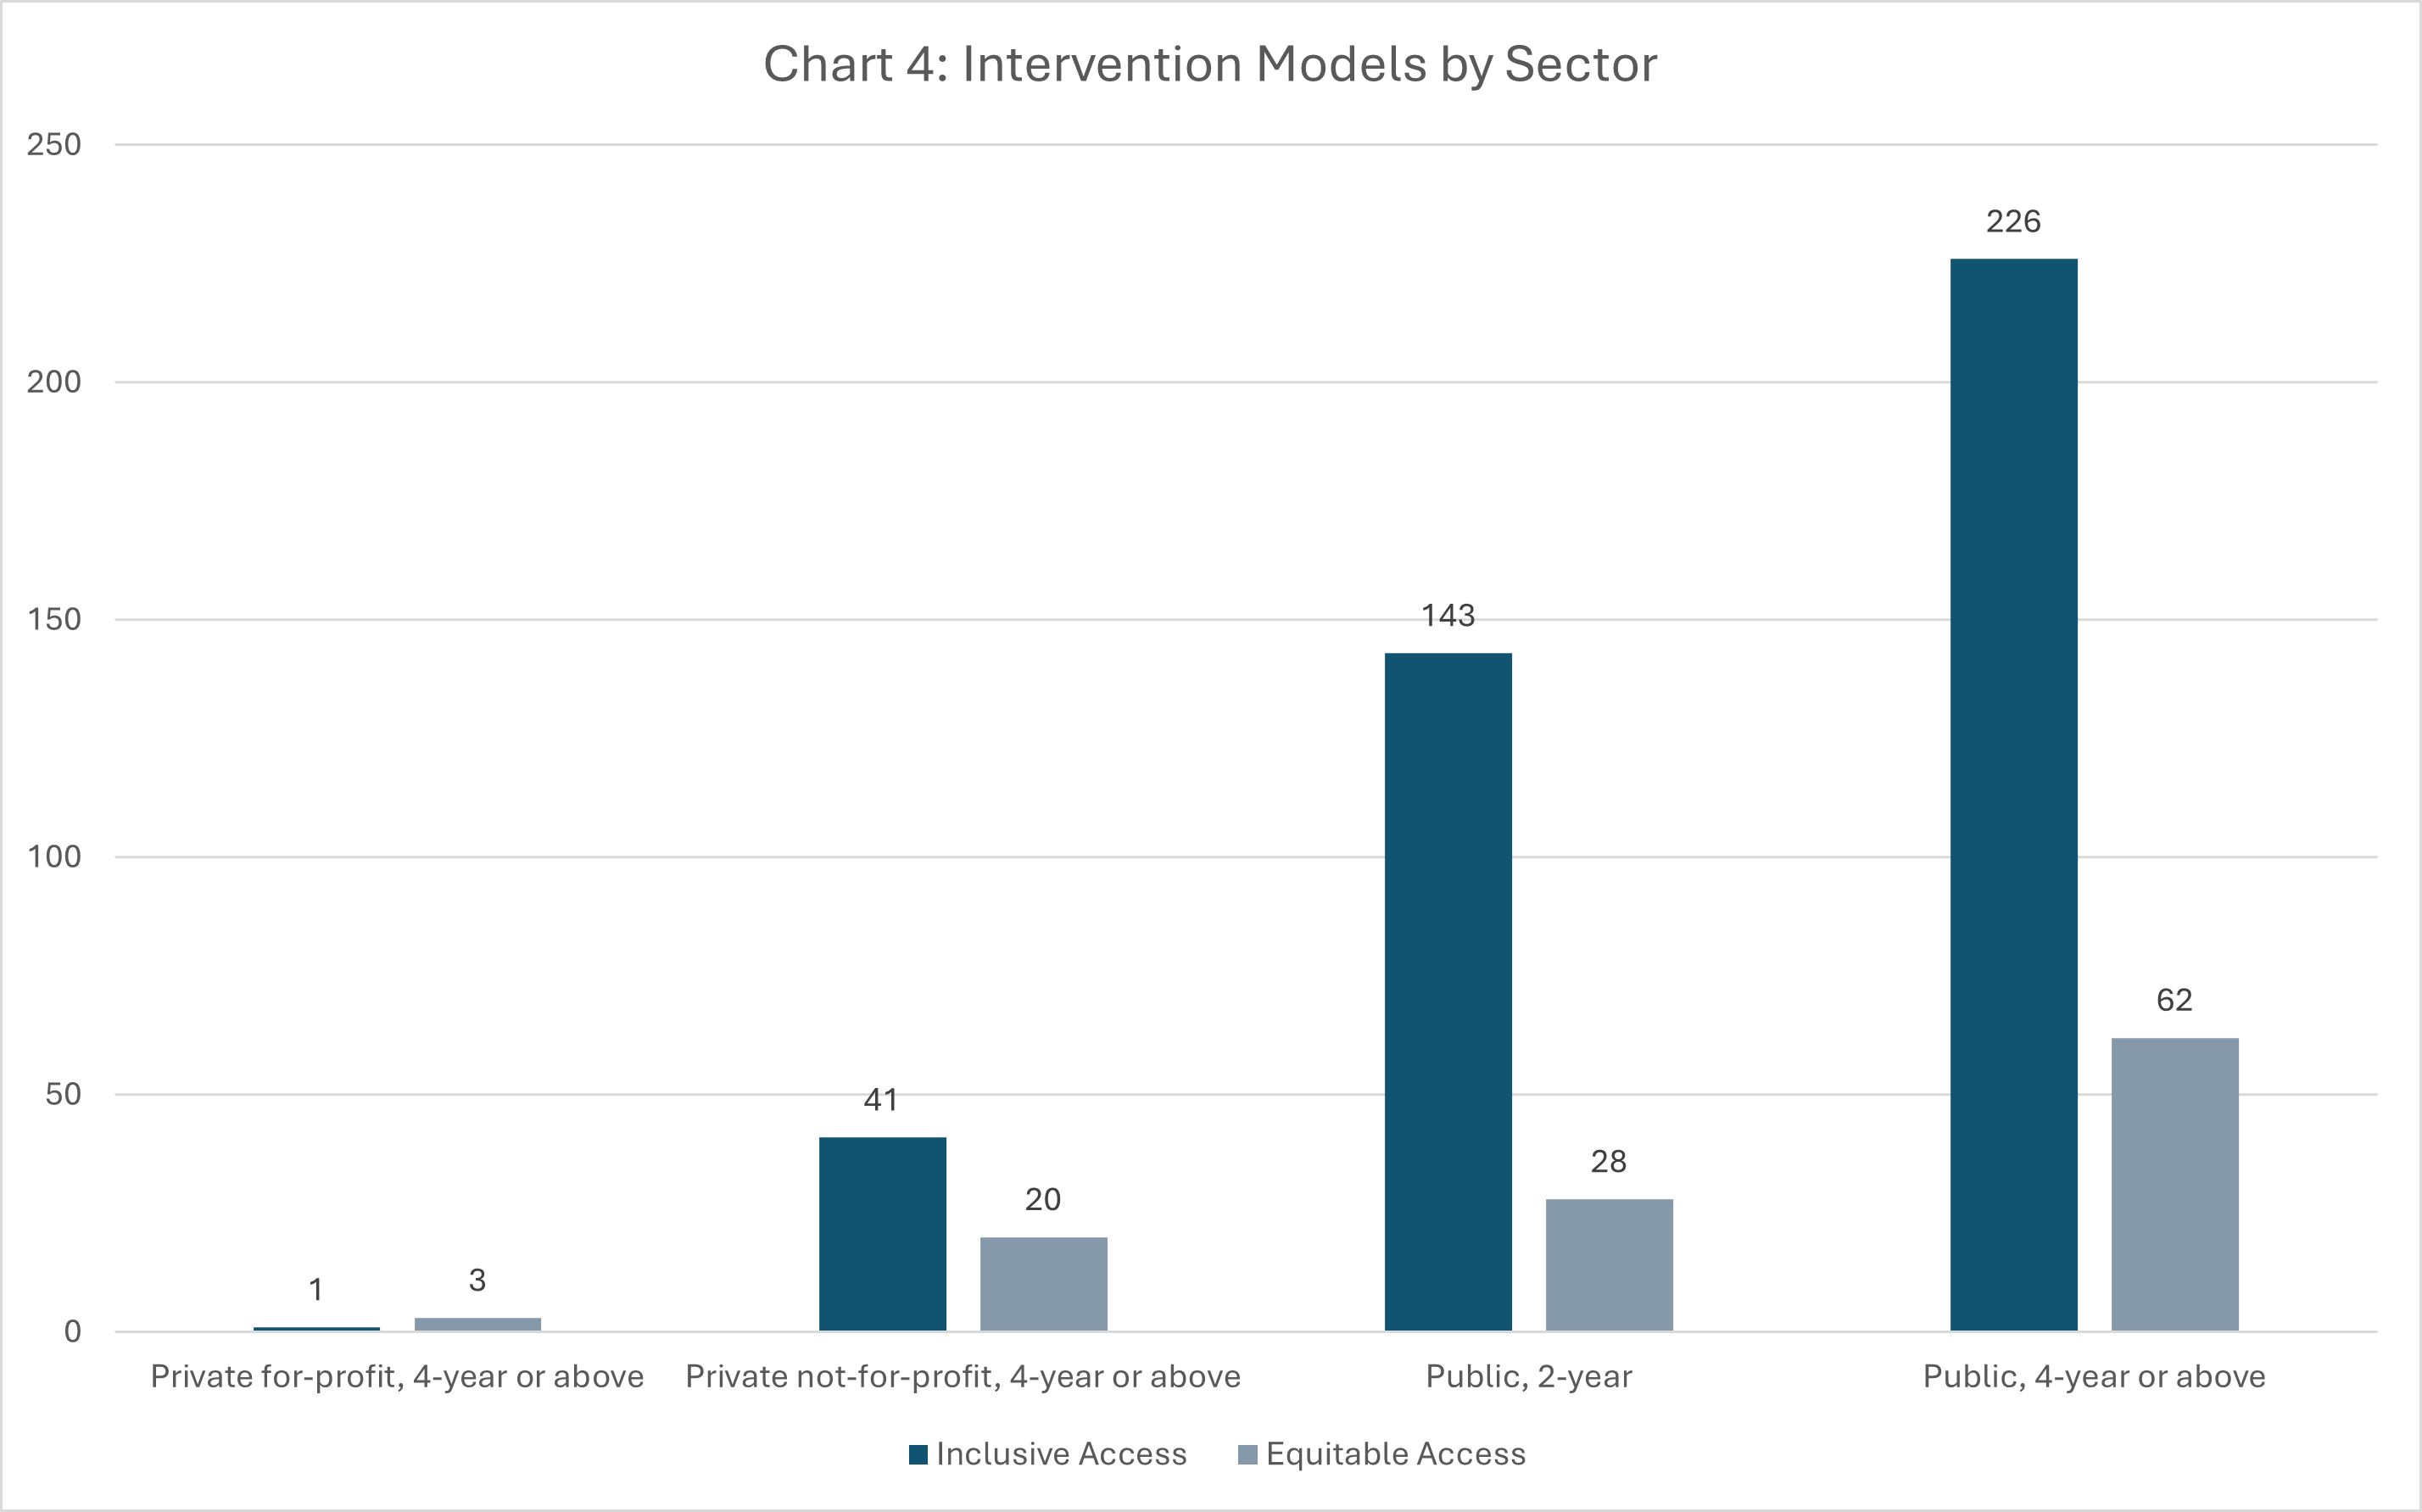
Chart 4 looks at access program types by sector. There are four sector types in this Top 1,000 segment: Private For-Profit (4Y+), Private Not-For-Profit (4Y+), Public (2Y), and Public (4Y+). In this sample, we can see that Public (4Y+) institutions have more widely adopted Inclusive and Equitable Access. This aligns with anecdotal evidence and things I have heard over the last few years . It is cool to see it validated in the Top 1,000 list.
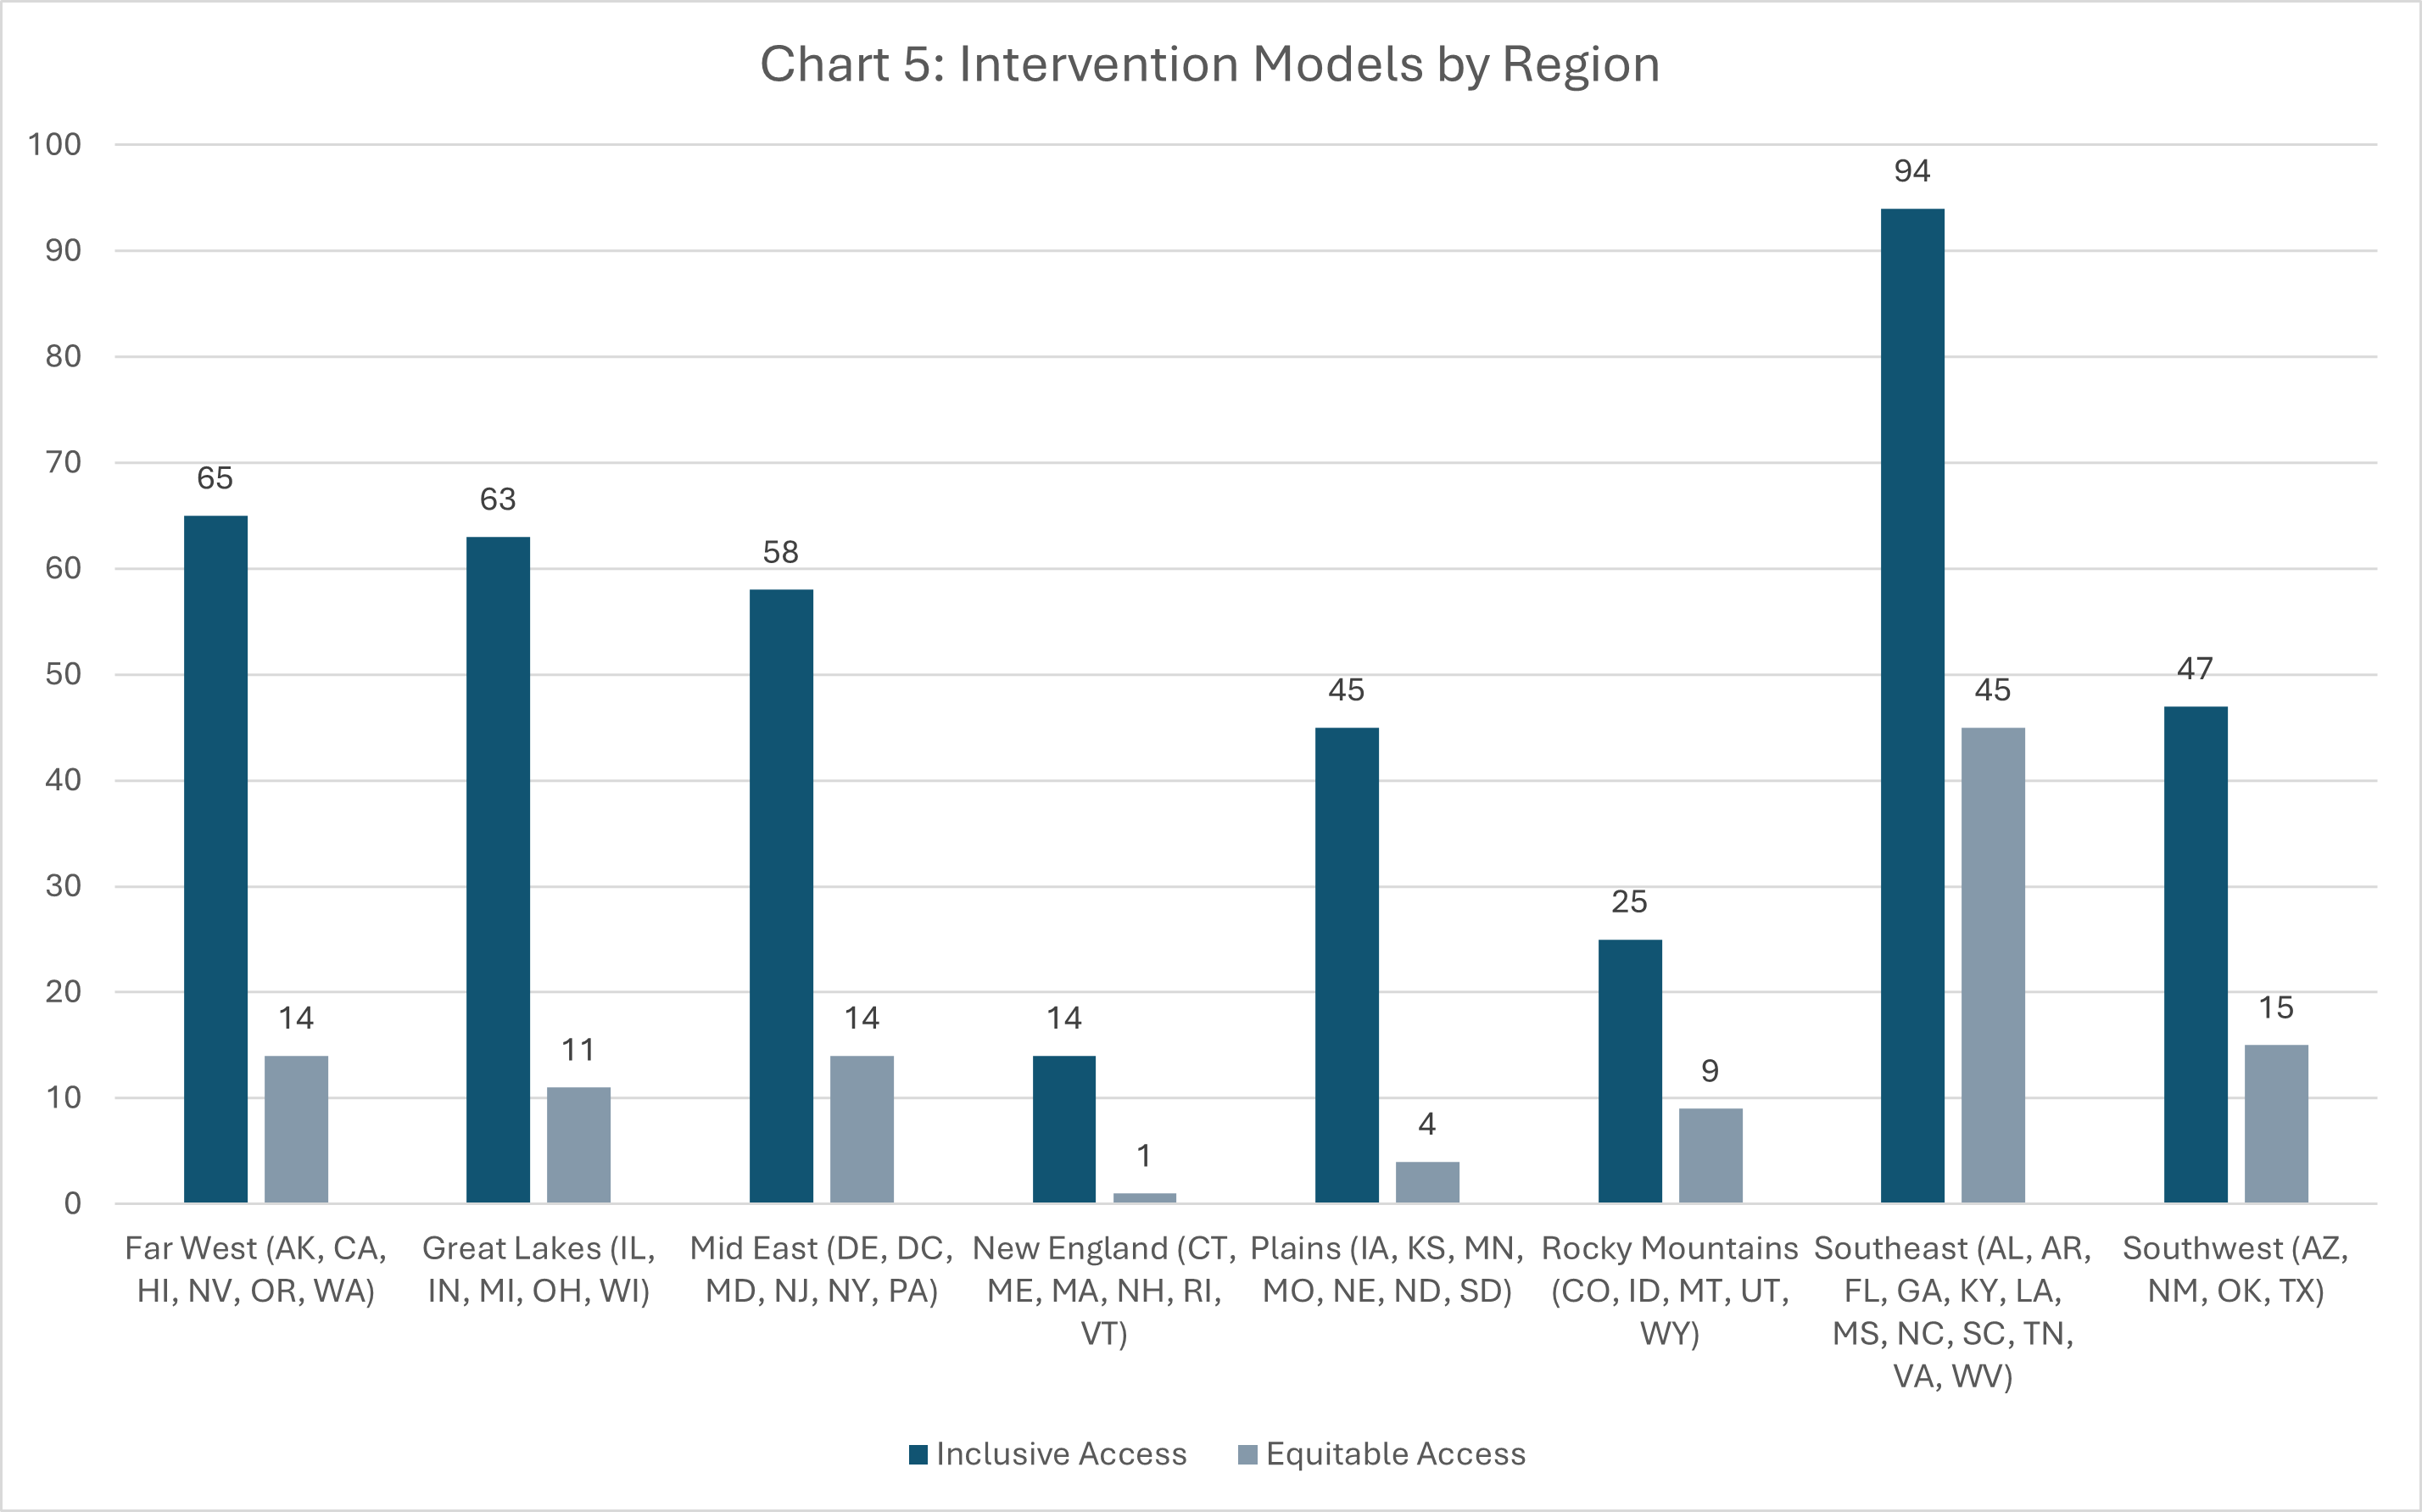
Chart 5 is just for fun. Since I had the variable, and we had already looked at program types by state, I figured why not? IPEDS has a region variable where they bucket institutions based on their geographic region. The Southeast region leads the list with 139 access programs followed by Far West (79) and Great Lakes (74).
Limitations
There are a few important limitations to this work that we need to address:
- The list of institutions and variable data are from IPEDS, which means I have no control over the variable data or its accuracy. Institutions self-report data to IPEDS.
- I could have made an error in contributing or not contributing an IA/EA program to an institution from my desk research.
- Multi-campus institutions only count once – sometimes. There are at least two schools in the Top 1,000 that I personally know have multiple campuses and are using IA or EA. IPEDS data counts those institutions as one single institution, therefore they are only counted once in this research. They were most likely counted as individual campuses in previous attempts I have made to understand the scale and scope of IA/EA. I am sure this limitation will be an area of contention once the list is complete.
- This is not, and was never intended to be, scientific research,
Wrap Up
This is just the start. Over the next few weeks and months, I will continue to scope the IA/EA market in hopes of presenting a more accurate and detailed picture of what the adoption of Inclusive and Equitable Access looks like across higher education. We hope that you found this first part of our work helpful or insightful.
If your campus is looking for support adopting a course materials intervention model like Inclusive or Equitable Access or evaluating your current program, we have limited space for 2025 to add new clients to our growing consulting portfolio. Contact us today to learn how we can help you drive unparalleled access to course materials and increased student success for your campus.
As always, thanks for checking in and I’ll see you next time.
-MM

